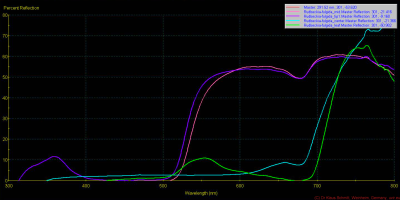
So how does a contaminated UV image look like? A first indication is that non UV reflecting parts (of a flower), that should look very dark, appeared lightened up. A good example to test is Rudbeckia (R. hirta was used here), as it has nearly completely UV absorbing petals in its lower petal parts towards the center, wheras the petal tips are very UV bright. My spectrometric research has confirmed that many times for different Rudbeckia species. Here an example for that:
[click on image to see a larger one]

Its gets pretty obvious, that the petal mid and base have very low reflection (pink line), wheras the petal tip (lilac line) has quite a UV reflection peak around 365nm. Now have a look at the right side of the graph, the visible (VIS) and near infrared (NIR) part of that spectra, from approx. 520nm onwards the reflection rapidly gets quite high, approaching some 50-60%). So any filter, that does not perfectly block these non-UV parts will show leakage i.e. flower parts that should be (very) dark will appear lightened up. Here an example for that:

Left shows the Baader-U filter used, middle and right show the results of using more (right) or less (middle) leaking UV filter stacks, here based on SCHOTT UG11 filter glass and a S8612 blocking filter glass (two different thicknesses were used, 2mm for the middle and 1mm for the right image). The flower petal parts that should be very dark, appear in a brownish red. [btw. stacking the two 1mm + 2mm S8612 filters onto the UG11 filter solves the problem, another proof for the leakage]
Remark: the actual color is irrelevant, as based on the whitebalance used, it could be basically any color. Important only is the intensity of these petal parts, which should be quite low, but isn't. Here another example for that, again Baader-U was used on the left image, middle and right are filter stacks (it is the same image, just differently white balanced).

Here another example, this time a Hemerocallis (Day Lily), left Baader-U, right a leaking filter stack was used:

All these images were shot using my UV camera and a flat, beyond 300nm transmitting CERCO f4.1/94mm quartz fluorite lens.
These filter stacks work basically the following way, explained using SCHOTT's filter calculation program for a similar filter stack. The obvious weakness for that case is around 700nm:

[courtesy and (c) SCHOTT]
So, be aware of these effects when assembling your own filter, or buying commercially available filters, as you may end up with useless "UV images", but they may look interesting nevertheless ;)
A hint and a simple explanation: a classic transmission chart of a filter in 0-100% linear scale does not show possible leakage issues. The exposure difference between UV photography and VIS/NIR photography is in the range of 8-12 exposure stops more for UV, so if a filter transmits in the VIS or NIR region more than OD3 (1E-03 or 0.001) it will most likely leak, since 10 stops equal a factor of 1024 i.e. 2exp(10), so 1/1024 = 0.001 that means a normal exposed UV image at -10EV and one through a filter that transmits 0.001 will be about equally exposed. But 0.1% in a linear 0-100% chart is pretty impossible to see, or can you see it here?

[courtesy and (c) SCHOTT]
It is the same example as shown above, just in the usually presented linear graph, so be aware.
There is a continuation of this article HERE.
Stay tuned, more will follow on that fascinating subject...
More info on this very interesting field may be found on my site http://www.pbase.com/kds315/uv_photos